
Performance you can examine
Explore the historical results, risk analysis and testing behind Valden Systems' automated trading systems.
Review the portfolio, compare exposure levels and inspect the supporting reports.
Three systems | Eight- year performance replay | 1,404 recorded positions
Historical simulations and conditional scenarios are labelled throughout. They do not guarantee future returns.
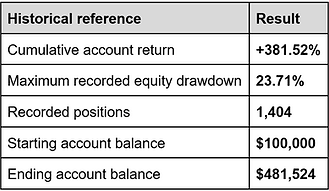
31 July 2018-30 July 2026 | Fixed 3 lots per system
This is a historical replay using 1-minute OHLC generated ticks. Results include swap, with no additional commission or slippage adjustment. Live execution can materially differ, see the execution-model comparison below.

Historical portfolio performance
Three systems. One shared account.
The historical reference combines USJPY, EURUSD, and AUDJPY on one account. It shows their combined performance, including floating gains and losses recorded during the simulation.


Position size changes
the outcome
The same trading can produce very different account returns and drawdowns depending on exposure.
The Capital & Risk Explorer lets you change starting capital, lot sizes, scaling thresholds, withdrawals and loss rules while inspecting how those settings would have behaved in the recorded history
Testing beyond the original backtest
Different tests adress different weaknesses. We keep their purpose, results and limitations seperate.

Reordering historical trades show how a different sequence of wins and losses can change the path, losing streaks and drawdowns.
These simulations preserve the underlying trade outcomes. Their ending profit is therefore unchanged by construction: their purpose is to examine sequence risk, not prove that future trading will be profitable.

